
1. Newark Liberty International, New Jersey (EWR)
- Percentage of delayed departures: 3.78%
- Reasons behind delays: Specific factors impacting departures at Newark Liberty International may include air traffic patterns and occasional weather-related disruptions.
Situated just 3 miles from downtown Newark, Newark Liberty International is one of the three major airports serving the New York City metropolitan area.
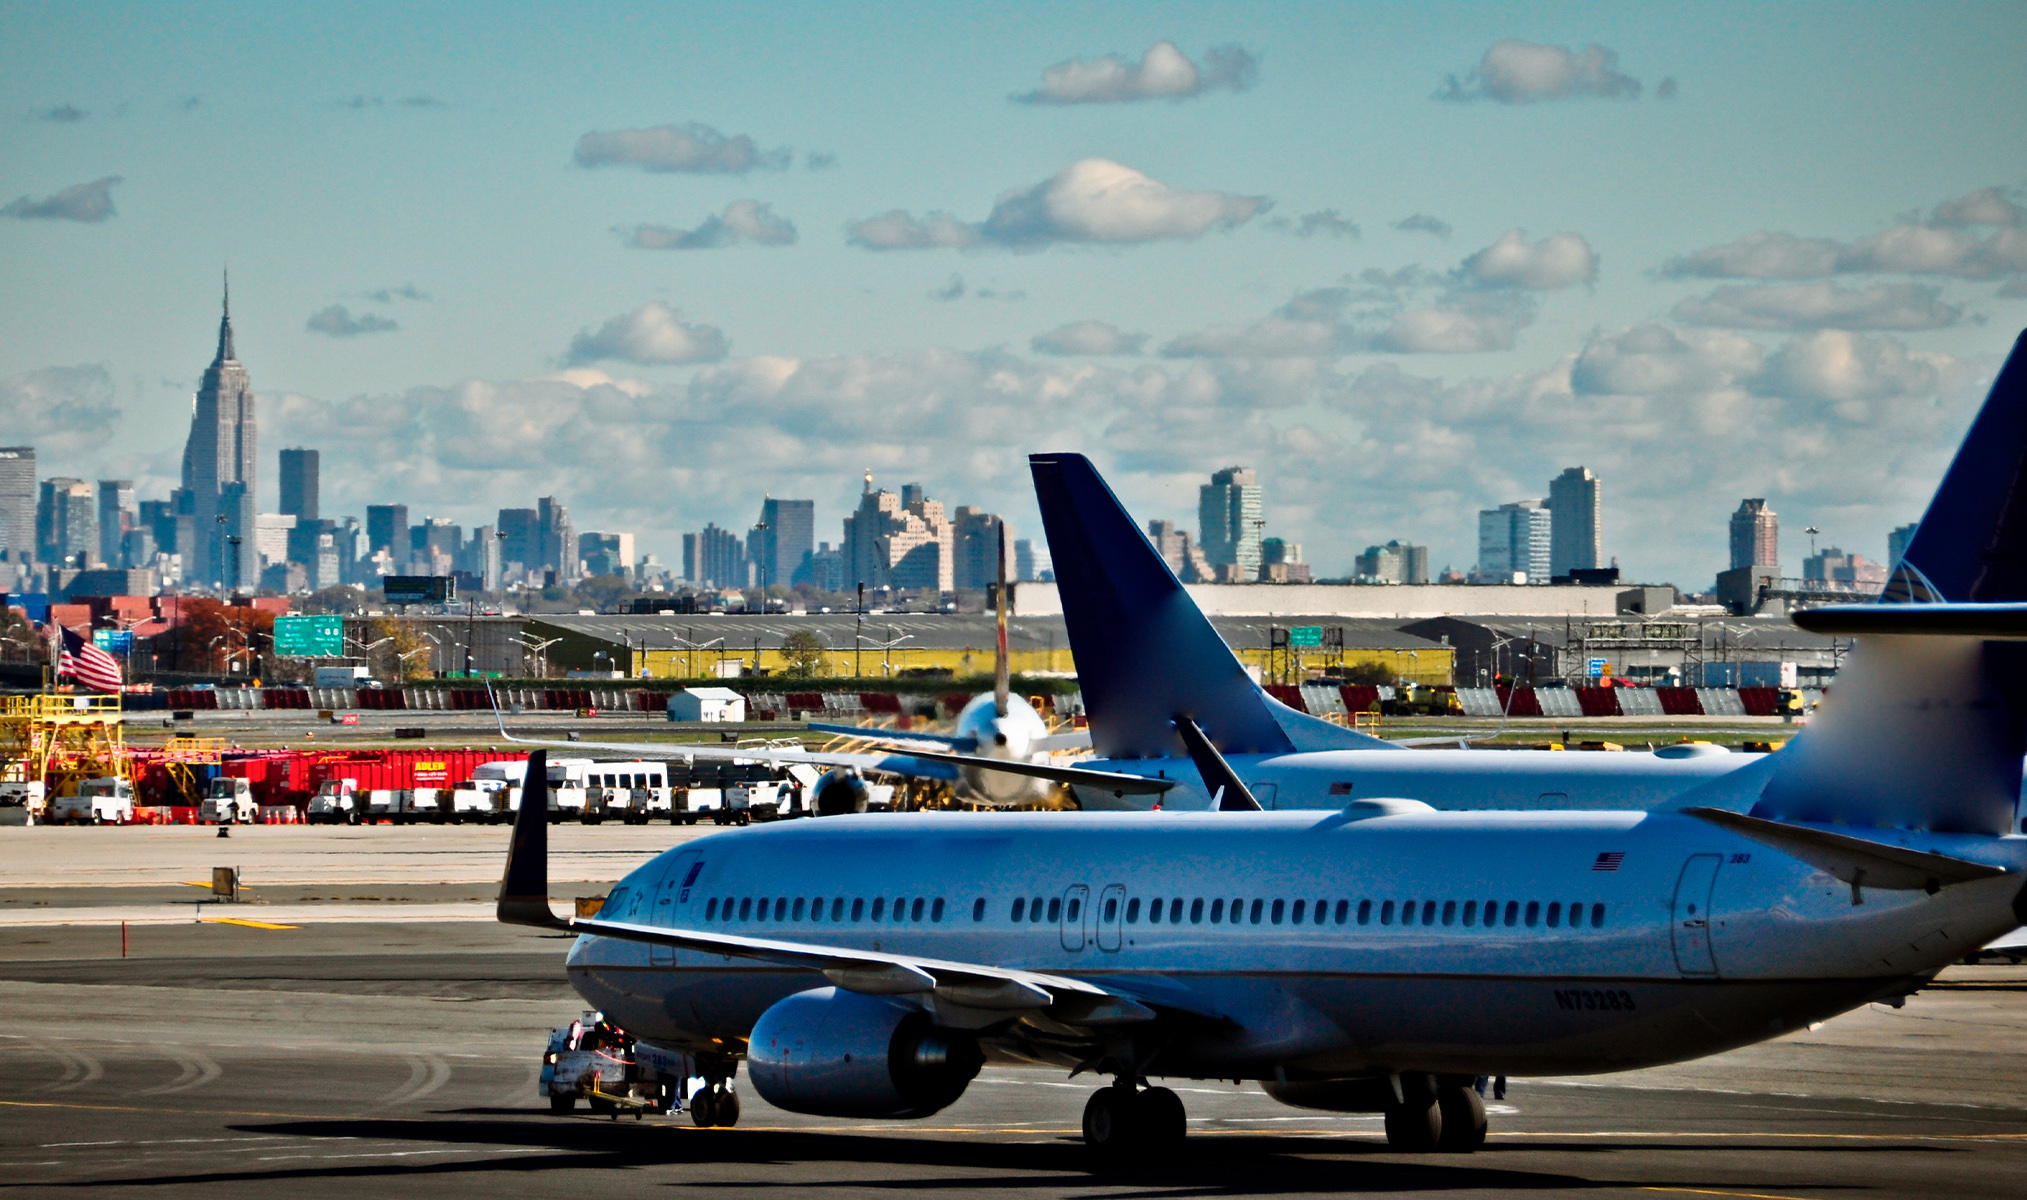
At Newark Liberty International Airport, only 3.78% of flights experience delays due to variations in air traffic and weather conditions, just 3 miles from the heart of Newark.
Photo: majicphotos/ Shutterstock.com
2. LaGuardia, New York (LGA)
- Percentage of delayed departures: 3.32%
- Reasons behind delays: Contributing factors may include airspace congestion and limited runway capacity, which affect departure schedules.
Located in Queens, New York City, LaGuardia is a key player in the New York City metro area.
3. John F. Kennedy International Airport, New York (JFK)
- Percentage of delayed departures: 2.91%
- Reasons behind delays: Operational complexities and occasional adverse weather conditions may impact departure punctuality.
Situated in Queens, New York City, John F. Kennedy International Airport is located 16 miles from midtown Manhattan.
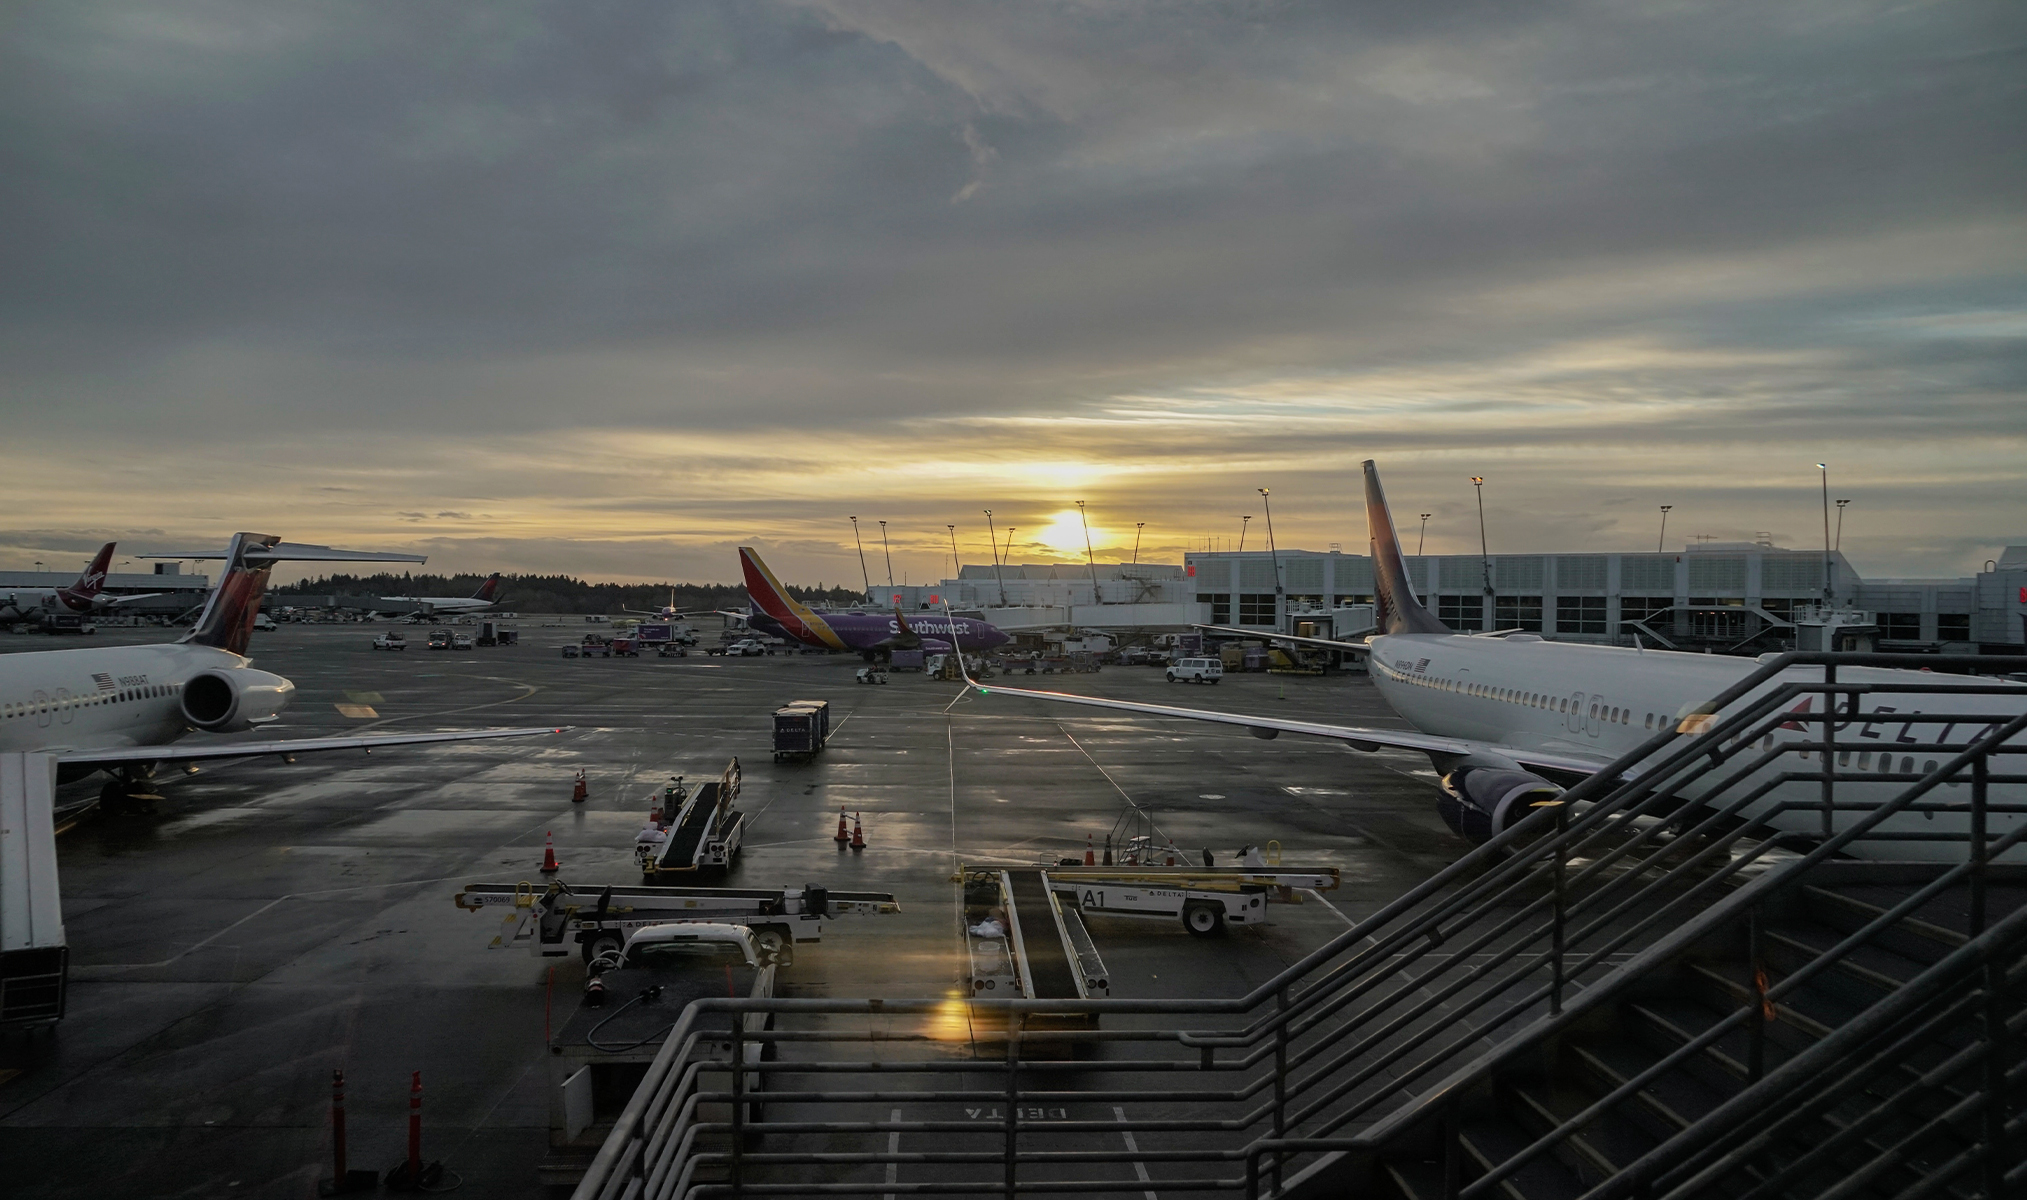
Dawn breaks over JFK International, where a mere 2.91% of flights face delays due to the intricate ballet of operations and nature’s caprice, 16 miles from Manhattan’s pulse.
Photo: Afif Ramdhasuma on Unsplash
4. Buffalo Niagara International Airport, Buffalo (BUF)
- Percentage of delayed departures: 2.52%
- Reasons behind delays: Unique factors such as local weather patterns and air traffic management intricacies may contribute to delays.
Located in Buffalo, New York, Buffalo Niagara International Airport serves as a key transportation hub in the region.
5. Norfolk International Airport, Norfolk (ORF)
- Percentage of delayed departures: 2.51%
- Reasons behind delays: Weather-related disruptions and air traffic management intricacies may impact departure schedules.
Serving Norfolk, Virginia, Norfolk International Airport plays a crucial role in connecting the region to various destinations.

Norfolk International Airport in Virginia sees a 2.51% delay in departures, often due to weather and air traffic intricacies.
Photo: Rocker Sta on Unsplash
6. Minneapolis-Saint Paul International Airport, Minneapolis (MSP)
- Percentage of delayed departures: 1.89%
- Reasons behind delays: Weather-related disruptions and air traffic management intricacies may impact departure schedules.
Serving the Minneapolis-Saint Paul metropolitan area, Minneapolis-Saint Paul International Airport connects the region to various domestic and international destinations.
7. Fort Lauderdale-Hollywood International Airport, Fort Lauderdale (FLL)
- Percentage of delayed departures: 2.47%
- Reasons behind delays: Operational challenges and occasional weather-related disruptions may contribute to delays.
Serving the Miami metropolitan area, Fort Lauderdale-Hollywood International Airport caters to passengers from Fort Lauderdale, Pompano Beach, Boca Raton, and beyond.

Fort Lauderdale-Hollywood International, serving the Miami area, faces a 2.47% delay rate due to operational hurdles and weather.
Photo: Nejron Photo/Shutterstock.com
8. Boston Logan International, Massachusetts (BOS)
- Percentage of delayed departures: 2.31%
- Reasons behind delays: Weather-related disruptions and occasional congestion may affect departure schedules.
Boston Logan International, often known simply as Logan, is the largest airport in Massachusetts and the entire New England region.
9. Dallas/Fort Worth International Airport, Dallas/Fort Worth (DFW)
- Percentage of delayed departures: 2.29%
- Reasons behind delays: High passenger traffic and occasional severe weather conditions may contribute to delays.
As the primary international airport for the Dallas/Fort Worth metro area, Dallas Fort Worth International Airport holds a significant position in the aviation network.

Dallas/Fort Worth International grapples with a 2.29% delay rate amidst bustling traffic and unpredictable weather, standing as a key player in global aviation.
Photo: Ritu Manoj Jethani/Shutterstock.com
10. General Mitchell International Airport, Milwaukee (MKE)
- Percentage of delayed departures: 2.27%
- Reasons behind delays: Unique factors such as local weather patterns and air traffic management intricacies may contribute to delays.
Serving Milwaukee, Wisconsin, General Mitchell International Airport connects the region to various domestic and international destinations.
11. Denver International Airport, Denver (DEN)
- Percentage of delayed departures: 2.19%
- Reasons behind delays: Operational complexities and occasional adverse weather conditions may impact departure punctuality.
As a major hub for domestic and international flights, Denver International Airport plays a crucial role in connecting the region to various destinations.

Denver International Airport, a key hub, experiences a 2.19% departure delay due to operational dynamics and weather.
Photo: Joseph Sohm/Shutterstock.com
12. Memphis International Airport, Memphis (MEM)
- Percentage of delayed departures: 2.11%
- Reasons behind delays: Weather-related disruptions and air traffic management intricacies may impact departure schedules.
Memphis International Airport serves as a key transportation hub in the region, connecting the area to various domestic and international destinations.
13. Gerald R. Ford International Airport, Grand Rapids (GRR)
- Percentage of delayed departures: 1.93%
- Reasons behind delays: Operational challenges and occasional weather-related disruptions may contribute to delays.
Located in Grand Rapids, Michigan, Gerald R. Ford International Airport serves as a significant transportation hub in the region.

Gerald R. Ford International Airport in Grand Rapids faces modest delays at 1.93%, navigating operational challenges and weather disruptions.
Photo: Piotr Piatrouski/Shutterstock.com
14. O’Hare International Airport, Chicago (ORD)
- Percentage of delayed departures: 1.90%
- Reasons behind delays: Unique factors such as air traffic patterns and occasional weather-related disruptions may contribute to delays.
O’Hare International Airport is a major hub for domestic and international flights, connecting Chicago to various destinations worldwide.
15. Dallas Love Field, Dallas (DAL)
- Percentage of delayed departures: 2.38%
- Reasons behind delays: Specific factors impacting departures at Dallas Love Field may include air traffic patterns and occasional weather-related disruptions.

Dallas Love Field serves as a significant airport in Dallas, providing domestic flights to various destinations.
Photo: Gabriel Tovar on Unsplash
16. Indianapolis International Airport, Indianapolis (IND)
- Percentage of delayed departures: 1.86%
- Reasons behind delays: While IND maintains a commendable record of on-time departures, occasional delays can be attributed to factors like air traffic congestion and weather fluctuations. The airport’s commitment to efficiency continues to make it a reliable gateway for travelers in the Midwest.
Serving the vibrant city of Indianapolis, Indiana, Indianapolis International Airport is a major aviation hub in the Midwest. With a reputation for its traveler-friendly facilities, IND provides a smooth travel experience for both business and leisure passengers.
17. Richmond International Airport, Richmond (RIC)
- Percentage of delayed departures: 1.89%
- Reasons behind delays: Despite its smaller size, Richmond International Airport occasionally experiences delays, often influenced by factors such as air traffic patterns and sporadic weather conditions. Understanding these factors can help travelers plan their journeys effectively.

Richmond International Airport in Virginia, though smaller, encounters a 1.89% delay rate, due to air traffic and weather nuances.
Photo: Mikhail Starodubov /Shutterstock.com
Nestled in the heart of Richmond, Virginia, Richmond International Airport plays a vital role in connecting the region to various domestic and international destinations. Although a smaller airport, RIC boasts efficient services and modern facilities.
Tips to minimize delays
Choose flights during off-peak hours
Consider picking flights during those quieter times of the day. It’s like avoiding the rush hour on the roads; fewer people at the airport generally means smoother operations and a better chance of your flight leaving on time.

Opt for off-peak travel for quieter airports and timelier departures.
Photo: Mikhail Starodubov /Shutterstock.com
Check your airline’s track record
Before you commit to a flight, do a bit of sleuthing on your chosen airline. See what fellow travelers are saying about their punctuality. A track record of timely flights can make a significant difference in your travel experience.
Allow for layovers
Embrace the layover! Sure, direct flights seem like express lanes, but flights with layovers can be like taking the scenic route. They often come with added flexibility, giving you a better shot at avoiding delays caused by crowded skies or unexpected hiccups.
Stay informed about airport and airline issues
Keep your finger on the pulse of your airport and airline. Regularly check for updates on how they’re doing. Whether it’s a website, an app, or a reliable travel news source, staying informed arms you with the knowledge to navigate any potential bumps in the travel road.
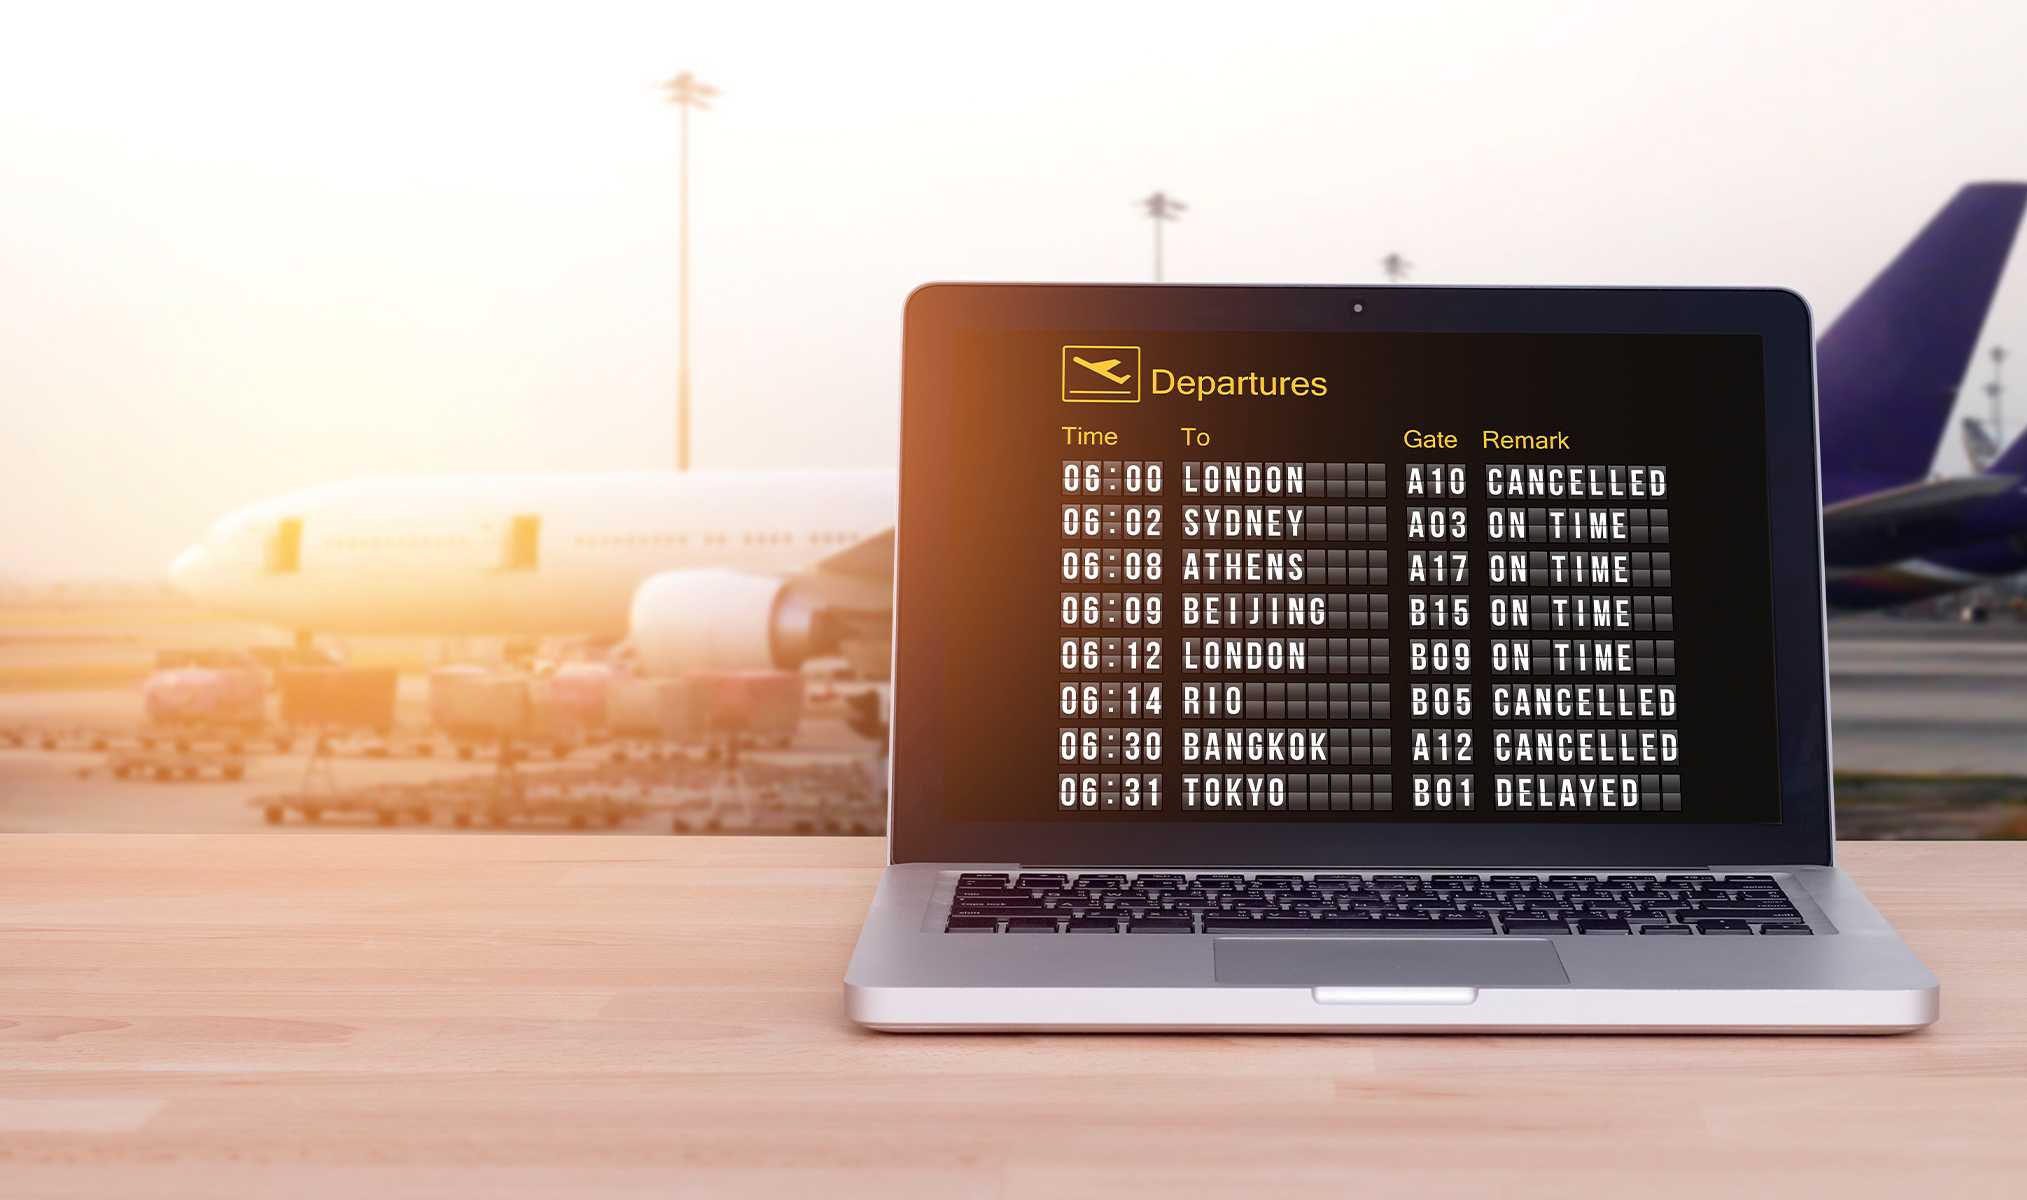
Stay updated on flight statuses via apps or websites to smoothly navigate your travel plans.
Photo: asiandelight/Shutterstock.com
Plan for contingencies
Murphy’s Law applies to travel, too. Have a backup plan. Travel insurance is like having a safety net for your plans. And keeping your schedule a bit flexible lets you roll with the punches if things don’t go as smoothly as hoped.
Use Roundtrip’s 24/7 support
- As a corporate travel manager, you’re well-versed in the intricate dance of planning business trips, from meticulously organizing travel records to navigating last-minute changes and cancellations.
- Enter Roundtrip, your dedicated travel planning solution that will revolutionize and simplify your travel planning experience. We understand the complexities of your position, and our user-friendly tools are designed to automate and streamline your travel plans and policies.
- Roundtrip stands by your side 24/7. Our multilingual support team is ready to assist you in over 12 languages.
- Whether you have questions, need assistance with bookings, or face any issues, our dedicated support team is just a call away. Additionally, a personal account manager will guide you through every step of your journey, providing the support you need for a seamless corporate travel experience.
Our journey has been a deep dive into the nuances of departure delays at various U.S. airports, each narrating its unique story, each wrestling with its own set of challenges. From the lively rhythms of New York to the expansive runways of Dallas, we’ve unraveled the tales of the top 17 airports facing the highest departure delay rates.
For our corporate travel managers, Roundtrip steps in as the dependable ally, simplifying the often stressful task of weaving through business trips.
The tools, which are as simple to use as a handshake, seamlessly automate travel plans and policies. Roundtrip’s 24/7 support, a travel guardian angel, and the personal touch of a dedicated Account Manager redefine corporate travel support with a touch of familiarity.